55% of Consulting Firms Run Negative EBITDA While the Top Performers Hit +27% — Here Is What Separates Them
Based on nearly two decades of SPI Research benchmark data, the article identifies the specific behaviors and operating decisions that separate the top 5% of consulting firms, who hit 27% EBITDA, from the 55% of the market running negative, and shows leaders what to do about it.
She sat across the table from Connor Budden and told him the business had underperformed because the market had been difficult.
He had heard this before. In nearly two decades of benchmarking professional services firms across 165+ KPIs, it is one of the most consistent things he encounters: consulting leaders who look at a difficult year and conclude that the difficulty is external.
But the data does not support that conclusion.
Last year, while 55% of the professional services market ran negative EBITDA, Level 5 firms grew revenue at 23.2% and posted 27% EBITDA. Same market. Different result.
The gap is not explained by conditions. It is explained by a small number of specific, observable behaviors that high performers display consistently and that most firms have never formally examined.
TL;DR
- Nearly two decades of benchmark data across professional services firms points to the same finding: market conditions do not explain the performance gap between the top 20% and everyone else.
- Level 5 firms (the top 5%) averaged 23.2% revenue growth and 27% EBITDA last year. Level 1 and 2 firms, which together make up 55% of the market, averaged negative EBITDA.
- High performers sustain that position through recessions, financial crises, and sector downturns. Their EBITDA is typically affected by 1 to 2 percentage points in a severe downturn. They absorb it and stay high-performing.
- The gap between top and bottom performers is explained by five measurable operating pillars and a small number of specific, observable behaviors. None of them require a favorable market to implement.
- This article shows you where the gap comes from, what the top firms do differently across leadership, talent, and client relationships, and what you can do about it in the next 90 days.
The performance gap is not what leaders think it is
Last year, Level 5 firms (SPI Research's top 5%) grew revenue at 23.2% year on year. Their EBITDA averaged 27%.
These are not outlier results from a favorable sector. They are the consistent output of firms that have reached what SPI calls “optimized maturity”: collaborative excellence, clear KPIs, every part of the business moving toward the same goal.
At the other end of the distribution, the picture is reversed. Level 1 firms grew at 1.7% and ran at -2% EBITDA. Level 2 firms fared only marginally better, with EBITDA of -1.9%. Levels 1 and 2 together account for 55% of the market. Nearly half the professional services industry was losing money on an EBITDA basis last year.
| SPI Level | Label | Approx. share of market | Revenue growth last year | EBITDA |
|---|---|---|---|---|
| Level 5 | Optimized | 5% | 23.2% | 27% |
| Level 4 | Institutionalized | 15% | High positive | Strongly positive |
| Level 3 | Deployed | ~25% | Moderate | Moderate |
| Level 2 | Piloted | ~25% | Low | -1.9% |
| Level 1 | Heroic | ~30% | 1.7% | -2% |
The instinct when looking at these numbers in a difficult market is to reach for an external explanation.
Connor has heard it many times.
"You have a lot of consulting leaders looking at the market, understanding that we're in tough times, and they see their business not performing as well. And they get to the conclusion that we're not performing as well because the market is in a downturn."
SPI Research has tracked firm performance through the 2007–2008 financial crisis, the Greek debt crisis, and Covid. In each case, the pattern holds: high performers see their EBITDA affected by 1 to 2 percentage points in a severe downturn. They absorb the impact and remain comfortably in the high-performing range. Level 1 and 2 firms were already running negative before the downturn arrived.
"They want to be able to blame something external," he says, "whereas actually there's probably a number of levers they can pull internally that would help them."
The market is not the variable that explains your performance. You are.
Industry-wide data supports the difficulty of the current environment: across the professional services sector, average revenue growth slowed to 4.6% last year, down from 7.8% the year before, and well below the five-year average of 8.7%. Billable utilization fell to 68.9%, below the 75% threshold SPI considers the minimum for healthy margin performance. Average EBITDA dropped to 9.8% from 15.4% the prior year. These are real headwinds. They explain why most of the market had a hard year.
What they do not explain is why Level 5 firms grew at 23.2%.
Five measurable operating areas explain it, each with specific behaviors that high performers display consistently.
The operating model behind the numbers
SPI Research structures its benchmarking around two frameworks that, used together, give any firm a precise map of where it stands and what it needs to change.
The first is the PS Maturity Model: five levels of organizational maturity, each with a defined operating characteristic.
| Level | SPI label | Defining characteristic | Approx. population |
|---|---|---|---|
| 1 | Heroic | Low maturity; performance depends on individual effort and heroics | ~30% |
| 2 | Piloted | Functional excellence in some areas; meaningful silos remain | ~25% |
| 3 | Deployed | Project excellence; cross-functional collaboration beginning | ~25% |
| 4 | Institutionalized | Portfolio excellence; teams working together and gelling | ~15% |
| 5 | Optimized | Collaborative excellence; everyone toward the same goal | ~5% |
The move from Level 1 to Level 4, the entry point for high performance, typically takes a firm around 3 years. The jump is not made in a single initiative. It is made through a sequence of deliberate, compounding improvements across five operating pillars.
The second framework is the Service Performance Pillars, the five areas SPI uses to assess and benchmark every firm in the study.
| Pillar | What it measures |
|---|---|
| Leadership | Vision, strategy, roadmap clarity; how executives align the organization |
| Client Relationships | The sales engine; how the firm builds, nurtures, and expands client relationships |
| Talent | Hiring, onboarding, attrition, utilization; how the firm finds, keeps, and deploys its people |
| Service Execution | Project delivery; on-time performance, scope discipline, methodology use |
| Finance & Operations | EBITDA, margin, billable rates; the financial health of the business |
Of these five, Leadership carries the highest weighted impact on overall performance, higher than any other pillar. That finding surprises most of the leaders Connor works with, in part because all of the questions in the Leadership pillar are subjective. There are no hard metrics for vision or strategic clarity. Yet subjective leadership quality is the single strongest predictor of firm performance in nearly two decades of SPI data.
If you are trying to decide where to focus first, the answer is almost always Leadership. Not because it is the easiest to improve, but because improving it creates the conditions in which every other pillar can function better. When every part of the business knows the goal, Finance can anticipate what Talent needs. Talent can align with what Service Execution requires. The whole system gets easier to coordinate.
What high performers actually do: Leadership
Connor has spent the last year interviewing leadership teams at high-performing firms, around 70 companies at the time of recording. Across that group, two behaviors show up in nearly every case. They are simple to describe and, in most firms, rare in practice.
Productive Paranoia
The first behavior is a specific kind of restlessness. He describes the scene: "We sit in a corner and I say congratulations for being a high-performing company. And the next question is, 'Okay, but that's great, but what can I do better?'" The leaders who sustain high performance do not feel secure in it. They treat their current position as a temporary state that requires active maintenance, not a status they have earned. Their default question is always forward-facing: what might erode this, and what should we be doing about it before it does?
Many of these leaders do not even fully recognize their own performance level. When Connor shows them their EBITDA figures and explains where they sit in the distribution, they are often mildly surprised. The metric confirms what they already knew, that things are going well, but they had not framed it as high performance. They had framed it as not yet where they want to be.
Active Humility
The second behavior is harder to name but easier to recognize. "They don't think they have all the information. They don't think they know what is best," Connor says. "And they're constantly hunting for where is the next little bit of information I can get." Not performatively humble; they are confident in what their business does well. But they do not assume that confidence means they have all the information they need.
This is why Connor speculates that communities like LEADERS IN CONSULTING likely have a disproportionate share of high performers, or firms moving in that direction. Belonging to a community that exists to share experience and challenge assumptions is itself an expression of active humility. You join because you do not think you have all the answers.
Distributed leadership
The structural expression of these two behaviors is a leadership model that does not depend on any single person. In high-performing firms, leadership is dispersed. Decision-making authority is pushed to the people closest to the work. The leader's job is not to direct every situation but to observe, and to input where it is needed.
Connor draws a direct line to AI: "You hear lots about AI being that the power of AI isn't really interacting with it one-on-one. It's orchestrating and managing a bunch of AI agents talking to each other. Well, guess what? High-performing leaders are already doing that with their human agents."
He puts the test plainly: "The machine runs fine without me, and if it doesn't, that's something I need to fix."
If your firm cannot perform at a high level for an extended period without your personal intervention in the details, that is not a testament to how important you are. It is a diagnosis of a structural problem in how the firm is built. High performers have solved that problem. Their leaders have created systems, norms, and clarity of direction that allow the organization to run without constant direction from the top.
The pattern Connor sees in lower-performing firms: one or two senior people who hold the key client relationships, control the most important decisions, and carry the revenue. The machine runs only when they are present. When they are not, performance degrades. That structure creates a ceiling, not on those individuals, but on the firm.
How high performers approach AI
The leadership behavior distinction extends directly into how firms are handling AI adoption right now, and it is one of the clearest real-time signals of where a firm sits on the maturity curve.
Non-high performers talk about AI in large terms. They describe transformation programs, significant changes to delivery, sweeping ROI targets. The ambition is high. The specificity is low. High performers are doing something different. They are looking for 1 to 3% incremental, compounding efficiency gains: specific, small, permanent improvements that accumulate over time.
A high-performing firm does not decide to "deploy AI to handle expenses." It goes one task at a time: "What's a pain point? Okay, a pain point is submitting expenses. We're going to deploy AI to read the receipt, scrape all the information off the receipt and put that in automatically. But then I'm going to deploy a second AI agent to de-risk 80% of those expenses, give it the ability to approve or reject expenses on behalf of the organization. However, if it's a big-ticket item, if it has something strange with it, if it doesn't have a very high confidence level, then loop a human in."
Two specific tasks. Measurable improvement. Permanent change.
The non-high performer approach to the same problem, "let's use AI for expenses," runs into the full complexity of the task immediately: different tax rules across jurisdictions, different expensing policies by role and region, exception handling for unusual items. It stalls because the problem was not broken down into solvable components.
High-performing leaders break it down. That discipline, finding the chunk that can actually be solved and solving it, is one of the clearest expressions of how they operate.
What high performers actually do: Talent
Most of what separates high-performing firms in talent is not pay, benefits, or training programs. It is a hiring criterion most firms treat as too soft to operationalize.
Hiring for Integrity
High-performing firms hire for integrity. Connor is precise about what that means in practice: "Integrity means that an individual is always going to do what is in the best interest of the team, even when no one is looking." Not when there is recognition attached. Not when a partner is in the room. When no one would know either way.
The most deliberate example Connor encountered started by identifying what made their best people exceptional. They found a pattern: their highest-integrity individuals were predominantly former military. The logic holds when you consider the context. In a military unit, every person's performance matters to the collective outcome. There is no individual success that comes at the team's expense. The operating default is always: what does the team need from me right now?
Rather than simply hiring ex-military candidates, which would be too narrow and would not scale, the firm took two of those individuals and made them a permanent part of the interview process. Their brief was cultural fit: "Would you trust this person when you're in the trenches of work next to you to do what they need to do?" That gut-level read, from people who had developed it in high-stakes conditions, became the filter.
The firm then did something that turned a soft judgment into a measurable process. They tracked the assessors' scoring accuracy over time. For each person who came through the cultural fit interview, they recorded whether the assessor's read proved correct during that person's tenure. Assessors whose gut judgments consistently produced high-integrity team members scored highly. Those whose reads were less reliable scored lower. The firm was indirectly measuring something it could not measure directly, and improving the process over time.
The Attrition Signal
The talent data that most directly distinguishes high performers is not utilization (though high performers run utilization up to 10 percentage points higher than non-high performers). It is the ratio between voluntary and involuntary attrition.
In high-performing firms, voluntary attrition runs at around 7 to 8%. People choose to leave. Involuntary attrition, people the firm asks to leave, runs at around 4 to 5%. In non-high-performing firms, both figures hover at roughly 4 to 5%. There is no meaningful gap between them.
This is counterintuitive. You might expect high performers to have lower voluntary attrition: better culture, more engaged people, fewer departures. The data shows the opposite.
Connor is careful about the interpretation: "I'm hypothesizing what's happening in the workplace, but they're creating a culture with which if you don't fit and gel to that culture, naturally you're going to remove yourself. That's not to say that you're not a high performer, it's just that you're not the right fit for that high-performance company."
Different blends of high performance do not all look the same. But cultures with clearly defined standards will attract people who fit them and surface those who do not.
The practical implication: if your voluntary and involuntary attrition rates are roughly equal and both are low, your culture may not be strong enough to attract the people who will thrive in it or to repel the people who will not.
Connor's framing on culture is deliberately non-prescriptive. There is no single right operating model. High-performing firms run on fully remote teams, on hybrid schedules, and on five-days-in-office models, and all three can sustain high performance. What matters is that the firm chooses its identity explicitly and executes it consistently.
"Decide on your identity and then lean into it" is how he puts it. The culture does not need to match anyone else's. It needs to be real, visible, and sustained enough that people know whether they belong in it.
What high performers actually do: Client Relationships
The management consultancy had delivered a strategy. The client was satisfied. The engagement closed. Most firms would move on.
This firm did not.
At regular intervals after the engagement, six months, twelve months, two years, consultants from the firm reached back to the client organization. Not to leadership. To middle management: the people who were not in the room when the strategy was designed, who received it as a direction to implement rather than a decision they had made. The conversations were short, a coffee, a brief call, and the question was simple: can you tell me what the strategy is?
Not "are you executing it." Not "are you happy with it."
Just: what is the strategy?
If the answer at the six-month mark is vague or incomplete, something has broken between the boardroom and the teams doing the work. The strategy exists on paper. It does not yet exist in practice. The firm now knows that. So does the client. And the conversation that follows, why isn't this landing at the operational level, is one that the consulting firm is uniquely positioned to help answer.
Connor identifies this as the defining characteristic of high-performing firms' approach to client relationships. He frames it as productive paranoia applied to client outcomes: "Are we giving the best that we can? Did it actually happen? I might listen to what you're saying but I'm still going to go and check. I'm still going to inspect what was the outcome of the input that we did." The principle he comes back to: "You don't expect what you don't inspect."
The commercial logic is not simply about relationship warmth. Firms that track client outcomes systematically develop something their competitors cannot replicate: real evidence of what their work produces. When a new client asks why they should choose this firm, the firm does not need to cite credentials or methodology. It can cite what happened two years after the engagement closed.
The Two KPIs Most Firms Are Not Tracking Yet
When Connor interviewed high-performing leaders across roughly 70 firms, he found that about half of them had independently arrived at the same two new performance metrics, without having compared notes or shared approaches. Neither metric appeared frequently in industry white papers or on social media at the time. Both had emerged organically from firms trying to understand whether their work was actually creating value.
Adoption measures the change in usage of a solution or system after a professional services engagement, compared to before. If a firm implements a platform and 50 out of 100 seats were active before the engagement, and 60 are active after it, that 10-seat increase has a measurable value. It makes the client stickier. It reduces churn risk. For implementation partners specifically, it also signals to the software publisher that this firm does not just deploy; it drives adoption. That changes the commercial relationship with the publisher, which in turn drives more referrals from the publisher to the firm.
Churn reduction measures the impact of a professional services engagement on the probability that a client will not renew at contract end. In the example Connor describes: where the firm engages with a client in the final six months before renewal, is there a measurable difference in churn rate compared to clients where no engagement occurred? In one firm's data, that engagement reduced churn probability by 13%. Against a $1 million software contract, the question becomes whether the cost of a $50,000 professional services engagement, potentially offered at no charge, is justified by the reduction in churn risk. In most cases at that contract value, it clearly is.
For management consultancies and other professional services firms that do not sell software, the churn metric translates into client return rate and expanded scope: does the client come back, and does the relationship grow? The firms that can answer that question with data are in a structurally different commercial position from the firms that cannot.
The focus problem
How many projects is your average project manager running simultaneously right now? How many of your consultants are split across three or more active engagements at the same time? When you staff a second project, do you default to pulling resources from an existing team, or do you draw fresh?
In high-performing firms, the answers to those questions look different from the industry norm. High performers run fewer projects per project manager. They put fewer consultants on each project. And when the same team takes on a second engagement, it tends to be the same set of people, paired again with the same colleagues they worked with before.
The output of that staffing model is a team that is in the detail of their work rather than spread across it. The consultants know the engagement deeply. They carry context from the last project together. They do not spend the first three weeks rebuilding working relationships or renegotiating how the team operates.
The performance benefit is real in both directions: happier consultants, better client outcomes, and higher revenue for the firm.
For firms whose projects are short-cycle, two weeks, 30 days, turnarounds that structurally prevent single-project focus, the adjustment is different but the principle is the same. Rather than grouping by project, high-performing short-cycle firms group by type. One consultant handles buy-side work. Another handles sell-side. One focuses on implementations, another on upgrades. The consultant builds depth in a domain rather than being a generalist spread across all of them. The firm gets the concentration effect even when individual project timelines are too short to justify full dedication.
In your current staffing model, are your people concentrating, or are they juggling?
Where to start: a 90-day diagnostic path
A firm that is not currently high-performing will not become one in 90 days. The journey from Level 1 to Level 4, the entry point for high performance, typically takes around 3 years. That is not discouraging. It is useful information. It means the work is structural, not tactical. It also means that starting now, with the right diagnosis, puts you three years ahead of starting next year.
Step 1: Self-assess across all five pillars
Before any action, you need to know where you actually stand. Use a maturity model (SPI Research's PS Maturity Model (https://spiresearch.com/slm3/) is available on their website at no cost) and score your firm honestly across each of the five pillars. Do not score where you aspire to be. Score where you are now. Bring two or three senior people into the process: independent scores on the same model will reveal disagreements about the firm's current state that are, by themselves, valuable information.
You now have a specific picture of where the gaps are, stated in a language that the whole leadership team can engage with. Connor puts the value of it clearly: "People know what you're going to say when you're not in the room, because they can go and have a look at the model. It already exists." The decision filter becomes institutional rather than personal.
Step 2: Identify the lowest pillar, then check whether leadership is suppressing it
The instinct is to address the weakest pillar directly. That is usually right, but not always. Before you act on the lowest score, ask: is the weakness in this pillar partially caused by the Leadership pillar? If your Talent pillar is weak because there is no clear direction about what kind of people the firm is hiring for, addressing Talent directly will not fix it. Improving the Leadership pillar, clarifying strategy and aligning the leadership team, may lift Talent as a downstream effect without a separate Talent intervention.
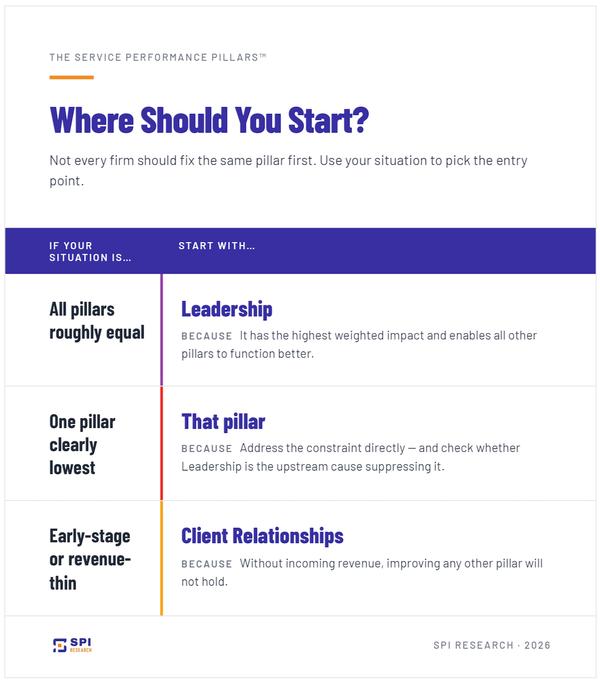
The three distinct starting conditions Connor describes:
Step 3: Take affirmative action toward the next level, not two levels ahead
The maturity model describes what each level looks like. Your job in the first 90 days is not to reach Level 4. It is to move from wherever you are to the next level. That is a small enough target to be achievable, and the model is specific enough that you can identify exactly what that move requires in your lowest-scoring pillar.
One concrete action: use the model as a decision filter for your leadership team. Before approving a new initiative, ask: does this move us from our current level to the next level in one of our weaker pillars? If yes, prioritize it. If it does not contribute to that progression, it can wait.
You now have a North Star that the whole leadership team can apply without your direct input on every decision.
Step 4: Get an outside perspective
This is where consulting leaders most consistently fail to apply what they know. You sell outside perspective to clients because internal teams cannot see their own organization clearly. The same is true of your firm. A maturity assessment done entirely internally is better than nothing. A maturity assessment with an outside facilitator, someone with benchmark data from comparable firms, is substantially better.
Being told that your leadership pillar is the problem, when you are the leadership, is also the kind of information you cannot reliably surface from within.
Closing Thought
The Level 5 leaders Connor spends time with share one experience that stays with him. When he tells them they are high-performing, they do not fully believe it. Not because they distrust the data. Because they are already looking at the next thing that could go wrong.
That posture, grateful for the evidence, unconvinced it is permanent, already asking what needs to improve, is not a personality trait. It is a discipline. It is available to any leadership team that decides to practice it. The firms at the top of the distribution did not get there by believing they had arrived. They got there by behaving as if they had not.
Frequently Asked Questions
1. What separates high-performing consulting firms from the rest in terms of financial results?
SPI Research's annual benchmark, drawing on data from 403 professional services firms, shows that Level 5 firms (the top 5%) averaged 23.2% revenue growth and 27% EBITDA in the most recent reporting year. Level 1 and 2 firms, which together represent 55% of the market, averaged negative EBITDA (-2% and -1.9% respectively). The gap holds across economic cycles: in major downturns, high performers see EBITDA impacted by 1 to 2 percentage points while remaining firmly in the high-performing range.
2. Do market conditions actually explain why consulting firms underperform?
Not as the primary explanation. SPI Research has tracked firm performance across the 2007–2008 financial crisis, the Greek debt crisis, and Covid. High performers sustain their position through each of these periods, absorbing a muted impact while non-high performers were already running at negative EBITDA before the downturn. The industry-wide data shows that average revenue growth slowed and utilization dropped in recent years, confirming that conditions are difficult, but those conditions do not explain why Level 5 firms continued to grow at more than 23%.
3. Which of the five SPI performance pillars should a consulting firm focus on first?
If all five pillars are roughly equal in maturity, start with Leadership. It carries the highest weighted impact on firm performance of any pillar in SPI's data, and improving it creates conditions in which other pillars function better. If one pillar is clearly weaker than the others, start there, but first check whether the weakness is caused by a Leadership deficit, in which case fixing Leadership upstream will produce better results. Early-stage or revenue-thin firms should prioritize Client Relationships before anything else.
4. What does "hiring for integrity" mean in practice for a consulting firm?
SPI Research uses integrity to mean a specific behavioral tendency: doing what is best for the team when no one is watching. One high-performing firm operationalized this by identifying that their most effective people were predominantly former military, professionals trained to operate for the collective rather than the individual. The firm added former military team members to the interview process specifically to assess cultural fit, then tracked whether each assessor's judgment proved accurate over time. The result is an indirect measurement of something that cannot be measured directly, improving over time through feedback.
5. What do voluntary and involuntary attrition rates reveal about consulting firm culture?
In high-performing firms, voluntary attrition (people choosing to leave) runs at around 7 to 8%, while involuntary attrition (people asked to leave) runs at 4 to 5%. In non-high-performing firms, both figures hover around 4 to 5% with little difference between them. Higher voluntary attrition in strong-performing firms likely reflects a culture with clear standards and norms that not everyone finds compatible, so people who do not fit self-select out. If your voluntary and involuntary attrition are roughly equal and both low, your culture may not be defined clearly enough to attract the right people or repel the wrong ones.
6. What are adoption and churn reduction as professional services KPIs, and why do high performers track them?
Adoption measures the change in usage of a solution or system following a professional services engagement. Churn reduction measures the impact of a PS engagement on the probability that a client will not renew at contract end. Around half of the high-performing leaders Connor interviewed had independently arrived at these two metrics without sharing notes. For implementation partners, high adoption rates also signal to software publishers that the firm drives stickiness, a commercial differentiator that generates referrals. For management consultancies, the equivalent is tracking whether the work produced a measurable change at the operational level, not just at the leadership level.
7. How should a consulting firm test whether its strategy is actually landing inside a client organization?
One high-performing management consultancy described returning to client organizations at regular intervals, six months, one year, two years, after a strategy engagement. Rather than speaking to the leadership team, they spoke to middle management and asked a simple question: what is the strategy? If the strategy could not be articulated at the operational level six months after delivery, something had failed between the boardroom and the teams doing the work. That diagnostic conversation opens a second round of substantive engagement, unpaid, that deepens the client relationship and builds real use cases for the firm's new business development.
8. How should a firm approach AI adoption differently at different maturity levels?
High-performing firms target 1 to 3% incremental, compounding efficiency gains from AI rather than large transformation programs. They identify specific, bounded tasks that can be automated, not broad functional areas, and build changes that are sustainable and permanent before moving to the next improvement. Non-high performers tend to approach AI with large ambitions and low specificity, which produces stalled pilots. The discipline of breaking a large problem (e.g., expense management) into a first solvable component (reading the receipt), then a second (approving 80% of submissions automatically against documented policy), is a direct expression of how high-performing leaders operate generally.
9. What does project staffing look like in high-performing consulting firms vs. the rest?
High performers run fewer projects per project manager, put fewer consultants on each project, and tend to pair the same resources across multiple engagements. The result is a team that is in the detail of its work rather than spread across it. For firms with short-cycle projects (two-week or 30-day turnarounds) where single-project focus is not possible, high performers group consultants by project type, buy-side vs. sell-side, implementations vs. upgrades, to build domain depth rather than spreading people across everything.
10. How long does it realistically take to move from low to high performance in professional services?
SPI Research's data indicates that the journey from Level 1 (Heroic) to Level 4 (Institutionalized), the entry point for high performance, typically takes a firm around 3 years. The progression is not linear and is not achieved through a single initiative. It is built through a sequence of deliberate improvements across the five performance pillars, compounding over time. In the first 90 days, a firm can complete a realistic self-assessment, identify its lowest pillar, check whether Leadership is suppressing it, and begin taking affirmative action toward the next maturity level, laying the structural groundwork for the full journey.
About the guest:
Connor Budden is Global Director at Service Performance Insight (SPI Research) and Co-Founder of The 1801 Consulting Group. In his role at SPI, he leads the firm's EMEA presence from London and is advancing SPI's frameworks and AI-driven analytics capabilities. He joined SPI as part of a strategic partnership announced in January 2025, combining SPI's nearly two decades of professional services benchmarking with 1801's operational transformation practice. Connor's work focuses on helping professional services organizations use benchmark data to identify performance gaps and take practical steps toward higher maturity. Connect with Connor on LinkedIn.
About SPI Research:
Service Performance Insight (SPI Research) was founded in 2006 and is headquartered in Knoxville, Tennessee. The firm is the leading independent research and benchmarking authority for professional services organizations, with nearly two decades of proprietary benchmark data. The 2025 PS Maturity Benchmark, the 18th annual edition, draws on input from 403 firms employing more than 150,000 consultants and generating nearly $60 billion in professional services revenue. SPI tracks 165+ KPIs and provides firms with a scored maturity roadmap across five Service Performance Pillars. Participation in the annual survey is free; the full report is available at spiresearch.com.
This article is based on an episode of the LEADERS IN CONSULTING Podcast, hosted by Sammy Gebele, Founder of Sawoo.
If you want to hear the full conversation behind this analysis with Connor, you can find the episode in the podcast section.
If you’d like to stay in the loop on future deep dives and community updates, you can subscribe to the newsletter here.
For more perspectives on how leaders are navigating challenges like this, follow LEADERS IN CONSULTING on LinkedIn.